Click on the words highlighted in tan to find out more.
Or, use the tabs above to go to a different section.
Or, use the tabs above to go to a different section.
Astronomy
|
|
|
Stop and rewind if you need.
|
|
Practice:
Click here to put the planets in order.
Click here to put the planets into groups.
Learn about the seasons.
Hertzsprung-Russell Diagram
Click here to put the planets in order.
Click here to put the planets into groups.
Learn about the seasons.
Hertzsprung-Russell Diagram
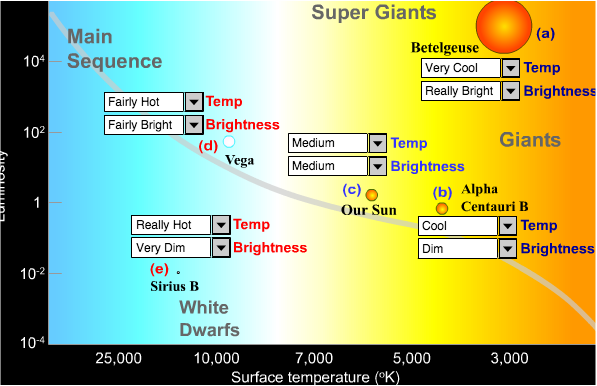
What does the Hertzsprung-Russell Diagram tell us?
Each circle is a star. In the center is our sun. (See the sun in the diagram on the right.) All the other stars on the diagram are being compared to our own sun’s brightness and temperature.
The vertical y-axis tells us the luminosity, or brightness, of a star. Sometimes this is labeled absolute magnitude.
The horizontal x-axis shows the surface, or outside, temperature of a star. It is usually measured in Kelvins.
How do you read the Hertzburg-Russell diagram?
Look across the bottom of the graph. Is the temperature increasing or decreasing? In our diagram, the left shows lower temperatures and the right shows higher temperatures. Another version of this diagram might show these values in the opposite direction.
Look at the side scale of the graph for the brightness.
Example:
Betelgeuse is in the upper right of our diagram. That means low temperature, but great brightness
Practice reading the Hertzburg-Russell star chart.
